
How to Use
Welcome to the New Cities Map user guide. Our map has more than a few features; below are step-by-step instructions for all of the map's features, and tips on how to get the most out of your time exploring.
Search
Click on the search element in the map's header to begin your search. Please note that only city names and countries can be used as search terms.
City Cards
Clicking on any city pin will open the corresponding City Card, which contains a preview of the information on that city. You can close this card by clicking on the white X.
City Cards in North America, South America, Africa, and India display
- Project status
- Master planner entity type
- Planned population
- Development site
- Announcement date
City cards in the rest of the world display:
- Project status
- Master Planner Entity Type
- Planned population
- Announcement date
While information on North America, South America, and India is complete, our research in Europe, Africa, and Asia is still ongoing. Therefore, not every region has the same number of completed data points.
Clicking on the “Read More” button will direct you to the city's full City Page. These are further described in the following section.
City Pages
Side Navigation
The Side Navigation bar offers three types of visualization features (Size By, Color By, and Show More) to further enhance the way the map's data can be analyzed and understood visually. There is also a Timelapse video of the cities as they were announced, and a feature that allows for the map's data to be downloaded as a spreadsheet.
Size By
Use this tool to visualize each city by size based on one of the following criteria:
Choosing any of these criteria will alter the size of the pins on the map, creating a range of pin sizes that will vary depending on the criteria. It will also prompt a new control overlay to appear at the top of the map:
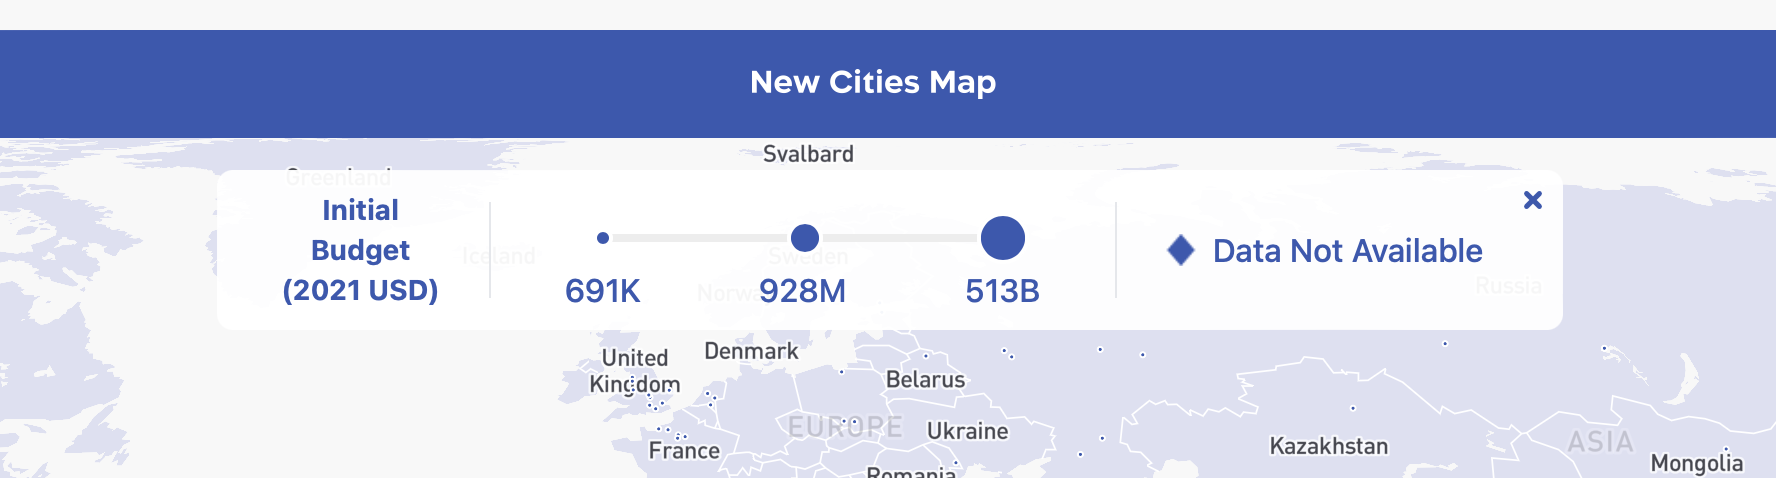
This overlay has three sections:
- The selected Criteria (which can be clicked on to quickly toggle through the list of Criteria available).
- A scale describing the values for this Criteria and their corresponding pin sizes.
- An indicator of the special hollowed out pin used on the map for cities that have no data available for that Criteria.
Size By, Color By, and Show More can be combined to work in tandem, refer to this section for more information on this feature.
Color By
Use this tool to visualize each city by color based on one of the following criteria:
Choosing any of these criteria will alter the color of the pins on the map, creating a range of colors. It will also prompt a new control overlay to appear at the top of the map:
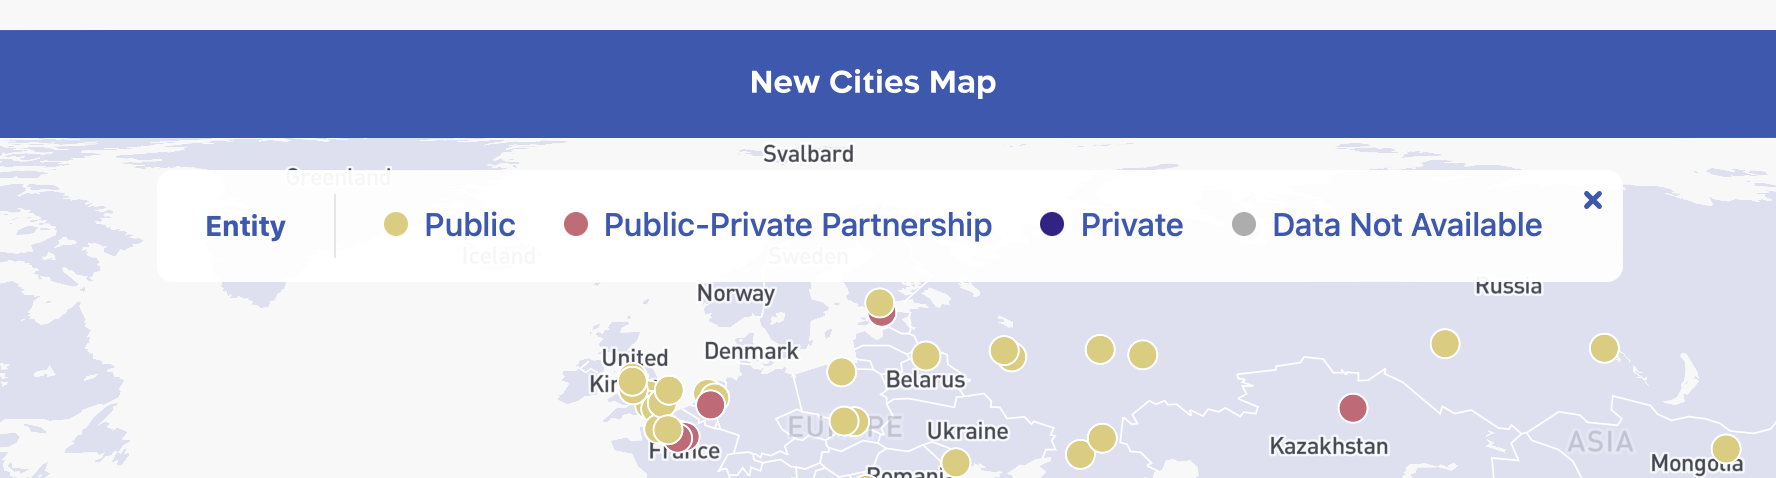
This overlay has two sections:
- The selected Criteria (which can be clicked on to quickly toggle through the list of Criteria available).
- A color range describing the values for this Criteria and their corresponding pin colors.
Color By, Size By, and Show More can be combined to work in tandem, refer to this section for more information on this feature.
Show More
This tool allows you to toggle visibility of all Airports, Seaports, and Capital Cities on the map:
Show More, Color By, and Size By, can be combined to work in tandem, refer to this section for more information on this feature.
Timelapse
The timelapse feature allows you to visualize the emergence of New Cities as they were announced. With this tool, you can see the progression of these cities from the initial announcement to their current state. This provides a unique and engaging way to understand the growth and development of these cities over time. To use the timelapse feature, simply click on the button below.
Download
The Download feature (accessible both in the Side Navigation Bar and the Header Navigation Bar) gives you access to all the raw information from the Master Planned Cities Map. Simply fill in the form to receive the data in your inbox:
Combining Size By, Color By, and Show More:
Size By and Color By can be combined to work in tandem. Simply choosing one option from each feature will alter the cities' pins, both in size and color, on the map, to simultaneously represent whatever criteria you have selected, providing you with a quick visual representation of data directly on the map.

When combining Size By and Color By, the indicator overlay for both features will appear on the map.
The options in Show More can be toggled on and off to work in tandem with Size By and Color By.
You can reset the map to its default settings at any time by clicking on the “Clear all filters” button at the top left of the map: